0x00 Preface
The story goes like this: I’m about to return to the institute. There are three dormitory options: Suzhou Street, Youth Apartment, and Ke Yi Zhao. Among them, Ke Yi Zhao is likely the worst. Suzhou Street has the best living conditions, but it’s a 6-person room with a long commute time, making Youth Apartment seem quite OK.
Since the quotas for Youth Apartment and Suzhou Street are limited, they are often allocated via a lottery. The most traditional lottery method is grabbing red envelopes. The strategy adopted by my lab is ‘winner takes all,’ meaning those who get the Top K of WeChat red envelopes get the better accommodation.
0x01 Analysis
Bi Dao analyzed WeChat red envelope grabbing back in 2020 BV1z7411e7qB1, concluding that everyone’s expected value is the same, but the later you grab, the more likely you are to get a ‘big red envelope,’ and the variance increases.
This leads to the probability of becoming the ‘Luckiest King’:
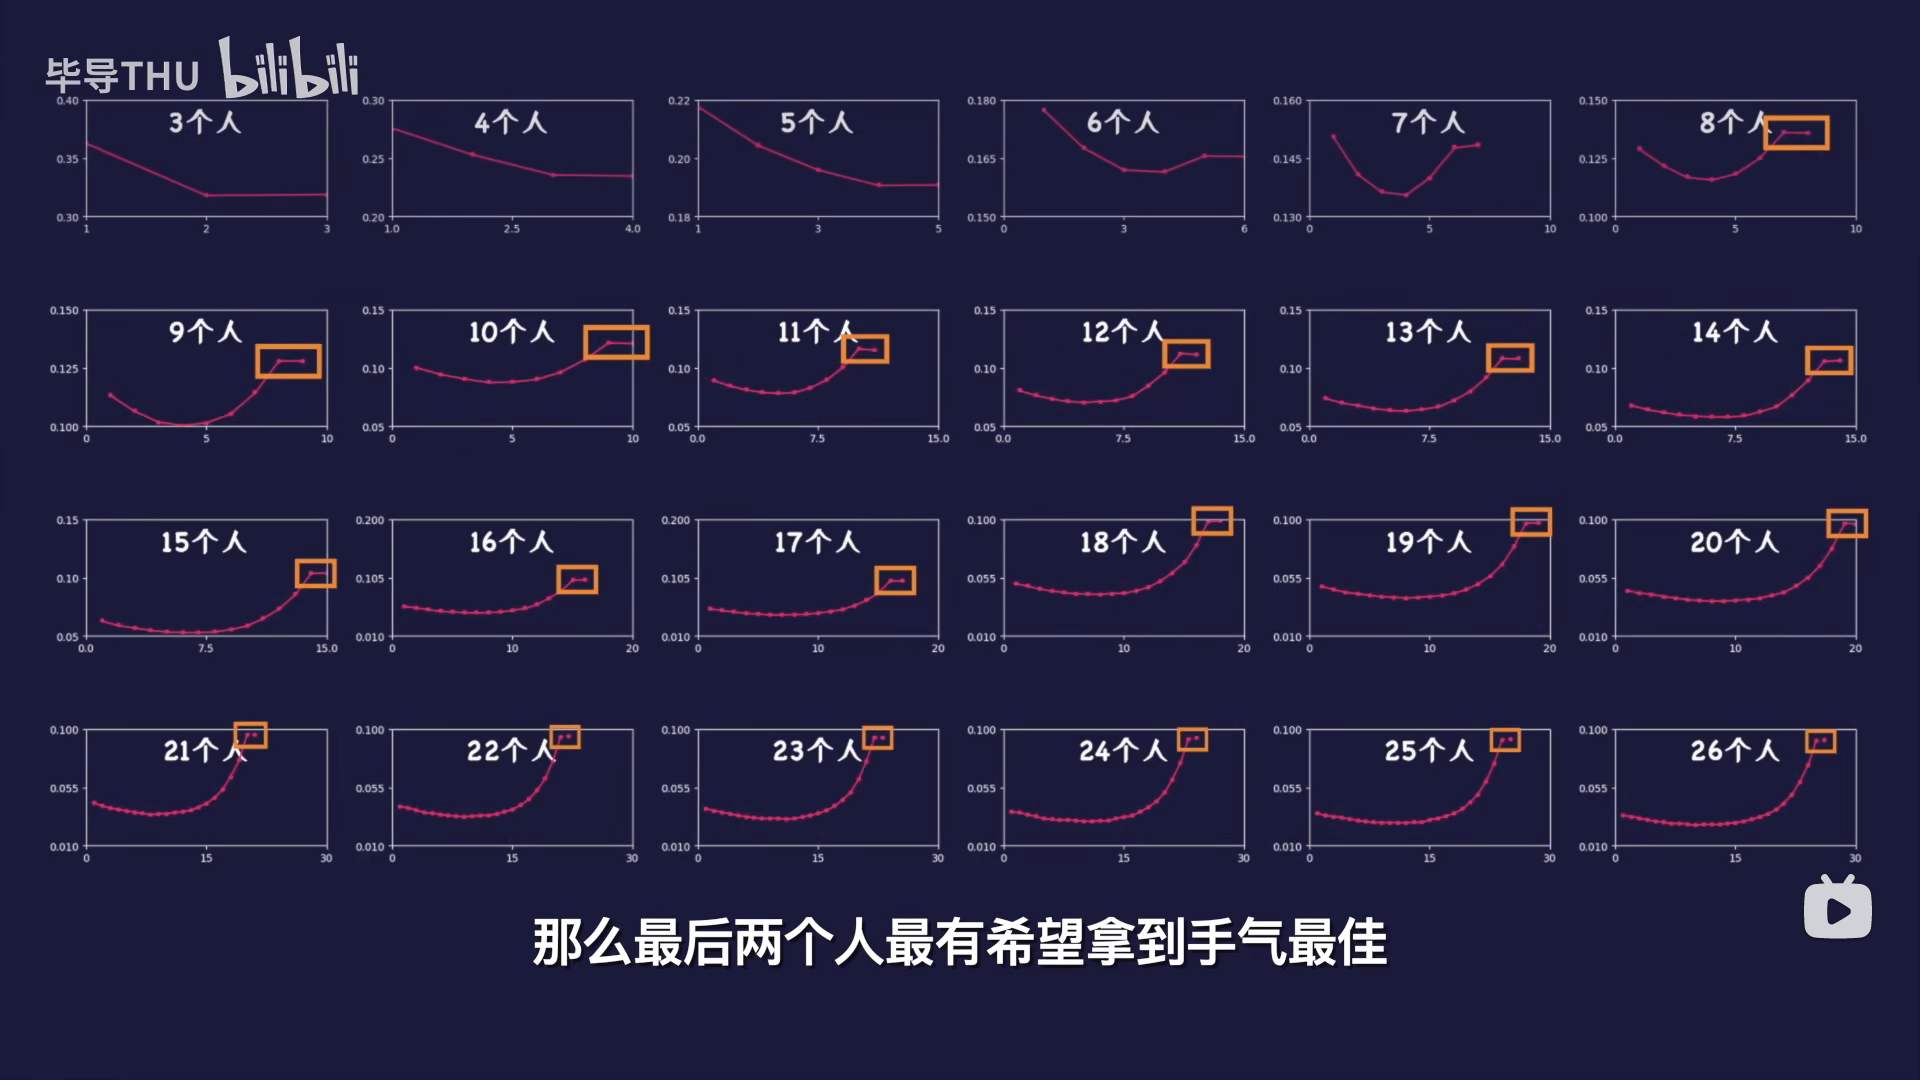
Under this condition, we hope not necessarily to be the Luckiest King, but to be in the Top K, so this can be considered an incremental work based on Bi Dao’s research.
0x02 Simulation
From Bi Dao’s video, we can see that WeChat red envelope amounts are distributed in [0.01, 2 * average of remaining amount]. Therefore, I used ChatGPT to write a simulation program, fixed some bugs myself, and here we only calculate for up to 20 people and the Top 10, simulating 100,000 times.
However, there are some pitfalls to note: first, the amount grabbed must be rounded to two decimal places; second, if it’s the last person, they must grab the exact remaining amount.
The code is as follows:
| |
0x03 Results & Conclusions
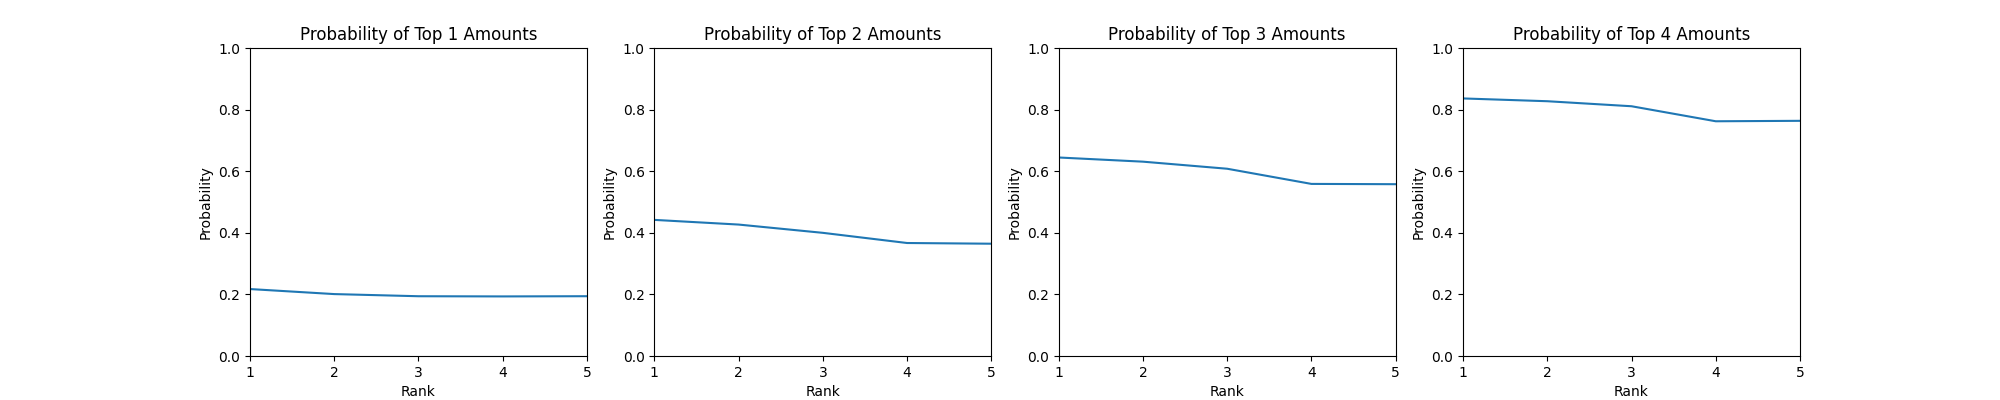
The results obtained are quite extensive; I will only display a few characteristic ones ($N = 2,3,4,5,10,20$).
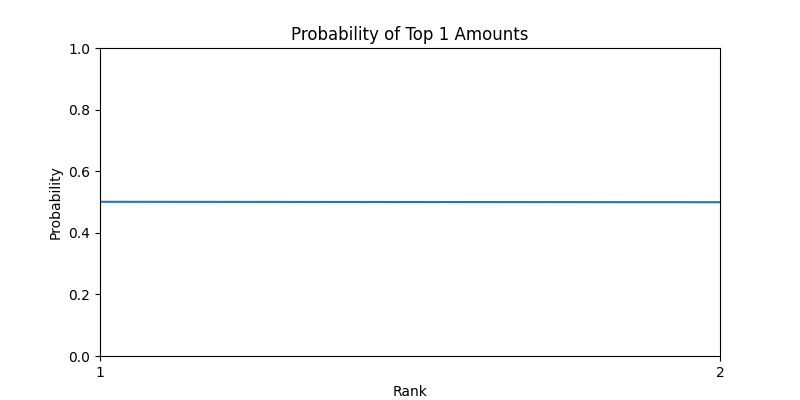
N=2
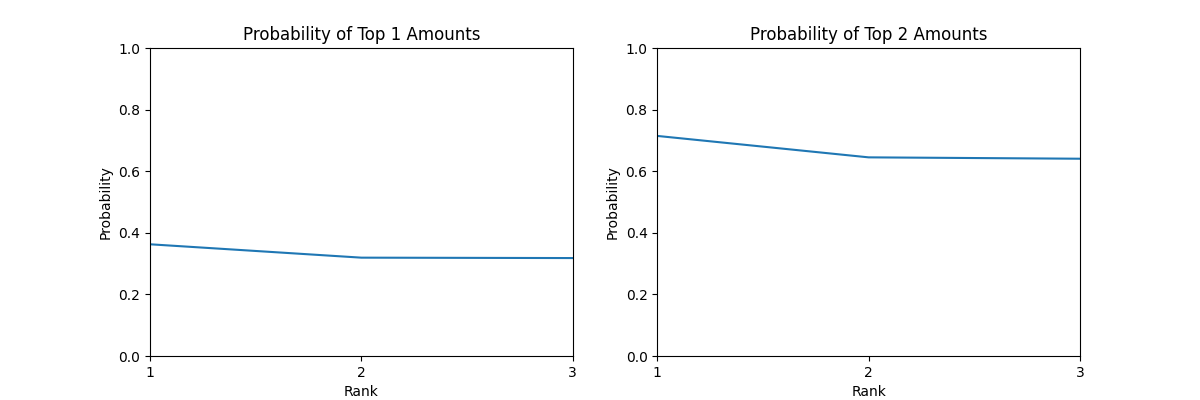
N=3
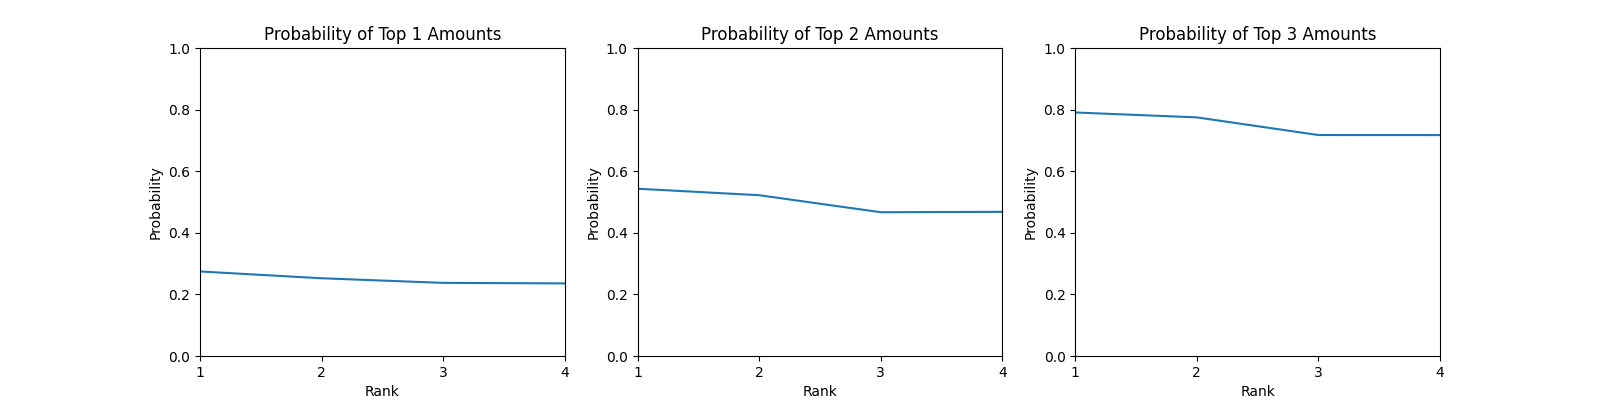
N=4
N=5

N=10

N=20
First, Top 1 is essentially the Luckiest King, used to compare with Bi Dao’s results to verify the correctness of my findings.
Regarding the Luckiest King, just as Bi Dao concluded, the more people there are, the higher the probability that the last two people will become the Luckiest King.
Regarding Top K, as K increases, this curve gradually changes from a concave curve to a convex curve, until finally becoming a monotonically decreasing curve. This is what is meant by ‘variance increases.’ As K increases, the probability of the last person getting a lower amount increases, thus the probability of entering the Top K decreases. At the same time, the probability of entering the Top K also increases in mean value as K grows, after all, the probability of 10 people getting Top 10 is always 1.
In other words, within a certain range, it is better to grab later to get the Top K, but when K exceeds a certain value, it is better to grab earlier.
So, where does this threshold lie? Let’s explore this question next.
There are actually some small tricks here. First, the person who grabs last is very special because their amount is not obtained through sampling. When calculating the turning point, if we consider making the entire sequence monotonically decreasing, the sequence becomes extremely unstable, even lacking clear patterns (non-increasing), requiring more theoretical calculation to support this conclusion. It is also heavily influenced by sampling errors, as the probability difference between the last two is not significant. Limited by my knowledge of probability theory, I leave this difficult problem for the reader to ponder. However, if we do not consider the last person and only consider the decreasing sequence of the preceding ones, then this threshold becomes increasing as N increases.
The plot of N regarding the threshold k is shown below:
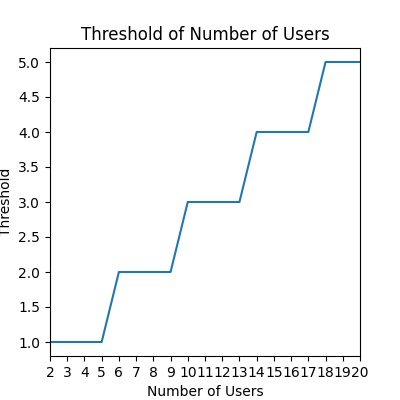
Curve of the threshold k regarding N
A conjectured conclusion is that this threshold k satisfies the following formula:
$$ k = \left \lfloor \frac{N-1}{4} \right \rfloor $$
As for why it is 4, it should be related to the distribution of WeChat red envelope amounts, but I lack theoretical analysis here.
0x04 Limitations
This is actually a setting of opposition among everyone. During the red envelope grabbing process, there is no information sharing, but in a real environment, you can ask classmates who have already grabbed to get the current number of people and the remaining amount. Under such conditions, the decision-making becomes more complex. For example, what should the decision be if previous people grabbed small red envelopes? What should the decision be if someone grabbed a very large red envelope? This problem remains to be explored and is left for the reader to think about.
There are still many points that have not been thoroughly studied, and limited by my probability knowledge, it is difficult to provide more probabilistic theoretical calculations. If readers are interested, welcome to discuss and exchange ideas in the comments section.